
ITEC-4020 Quality Management Standards for IT
| Quality Performance Excellence: A Brief Biography of Kent Beck |
Extract: “Kent beck is the founder and director of Three Rivers Institute (TRI),” which is an organization devoted to monitoring the influence of agile methodologies in the software world (Beck, na). He is also the creator of extreme programming, a method of systems development which is a “highly adaptive approach to the SDLC” (Systems Development Life Cycle) (Satzinger, Jackson, & Burd, 2009, p. 63). Additionally, Beck has done a tremendous amount of work improving upon JUnit which “is a simple framework to write repeatable tests” in Java (JUnit.org, na). Beck firmly believes that quality comes from the group ownership, rather than the singular ownership, of code (Cunningham, 2003) (Beck, Extreme Programming wtih Kent Beck, 2009).
|
The Effects of Poor Quality
For management, poor quality affects their ability to strategically plan and coordinate organizational functions through a constant need to play catch up with competitors (Evans, 2010, p. 23). That is, poor quality in manufacturing means that output is degraded causing waste and leading to overspending and a decreased market presence through lack of goods. Poor service quality, on the other hand, leads to a direct loss of business through immediate bleed off of customers. That is, customers will refuse goods and services which they deem to be poor quality, and take their money elsewhere (Evans, 2010, pp. 17-18). Owners see this lack of capital gain as a direct loss to their investments. As such, they are likely to sale their claims, being stockholders, or move to replace management in the hopes of increasing quality through superior direction. In a sense, owners want goods and services to be as pleasing to customers as customers want them to be. Stakeholders, or those people directly working to create the goods or services, are affected by poor quality through decreased job satisfaction and/or physical duress. That is, stakeholders are internal customers of themselves and other business units (Evans, 2010, pp. 24-25). Unfortunately, they are not able to take their business elsewhere, but instead display dissatisfaction through decreased performance and increased defects causing even greater quality control issues. Management’s focus when it comes to quality is on how that quality directly affects the organizational bottom line. As such, systems and cultures within the business which cause waste are where quality control standards will be their primary concern. Conversely, customers focus purely on the output, service or product, and how that output’s quality benefits their needs and wants (Evans, 2010, pp. 17-18). The processes which deliver the output and the culture of the service interaction are customer’s key interests. Processes which improve monetary growth and therefore increase the organizational worth are the focus of the organizational owners. If these processes are directly affected by poor quality standards, than immediate directorial interventions are made either through decreased investment or increased pressure on upper management. Stakeholders focus their attention on all aspects of the business. Any area which causes undue strain on stakeholder interaction will likely lead to decreased quality output. Quality affects all stakeholders internal and external. In other words, poor quality leads to customer dissatisfaction, which leads to lower profits, hence increased pressure from owners, which bleeds through to management initiatives causing pressure and change on employees, further causing quality to change in accordance with management direction. If all parties are not considered by management when quality changes are implemented, it is likely to lead to further quality degradation, rather than increased profit gain. Improved quality leads to more business, more profit, and more jobs (Evans, 2010, p. 50). Reference Evans, J. R. (2010). Quality & Performance Excellence: Management, Organization, and Strategy (6th ed.). Mason, OH, USA: Cengage Learning. |
Quality Initiatives: British Petroleum Gulf Oil Disaster
As much as I dislike saying this, the primary factor that is going to make BP do anything, such as implement quality initiatives, is whether there is a financial incentive to such a thing. Since the disaster, “BP has sold $40 billion of assets and paid out more than $45 billion in cleanup costs and damage claims” (Barrett, 2013). When first put into operation, the Deepwater Horizon oil rig was “valued at more than $560m,” the explosion and subsequent fire have now obliterated this hard capital (Pulham, Hilaire, Fenn, & Department, 2010). Moreover, the US government is seeking an additional “$17 billion from BP under the Clean Water Act” (Barrett, 2013). If this is not financial incentive enough, I do not know what is. Quality initiatives which BP should first and foremost come to terms with are safety and disaster recovery (DR) mechanisms. A known disaster recovery plan developed by BP is shown to be full of faults, thereby proving that BP had no viable recovery options in the chance of such a disaster as the Deepwater Horizon disaster (Pulham, Hilaire, Fenn, & Department, 2010, pp. 73,139). Further to this, “alarms were switched off at the time of the explosion to enable workers to sleep” rather than address the mounting disaster which could have been stopped (Pulham, Hilaire, Fenn, & Department, 2010, p. 119). The DR plan should be fixed and reviewed by a third party audit organization to ensure accuracy and compliancy. Additional safety measures on BP's oil rigs must be implemented and must also be reviewed by a third party organization. As quality comes from ensuring a product or service is delivered to the customer, safely, then BP should completely overhaul its safety board. “BP dismissed the possibility…that a catastrophic accident could happen at Deepwater Horizon” (Pulham, Hilaire, Fenn, & Department, 2010, p. 22). However, BP engineers were concerned about safety on Deepwater Horizon in June of 2010, nearly ten months before the disaster took place (Pulham, Hilaire, Fenn, & Department, 2010, p. 60). Additionally, “BP and Halliburton were aware of flaws in the cement used to seal the well” which “failed three out of four tests carried out before the explosion” (Pulham, Hilaire, Fenn, & Department, 2010, p. 156) (Aeberman, 2010). By ignoring these quality control mechanisms, BP management ensured this catastrophe would occur at some point in time. Finally, the image BP displayed during the entire disaster was one of profound self-interest and disregard for the pain and suffering their actions were causing to thousands if not millions of other people. Incredible gaffes such as the one the BP CEO, Tony Hayward made about “wanting his life back” only proved to the public that BP did not have the public and its customer’s safety in mind (Pulham, Hilaire, Fenn, & Department, 2010, p. 59). As quality initiatives are all about improving customer satisfaction, BP definitely need to rethink their service standards and how image comes from the top down. In the end, shareholders displayed their dissatisfaction with BP's customer service with a massive sell off, dropping the share price to a low of £3 at its lowest (London South East, 2013). Reference Aeberman. (2010, May 21). What Caused the Deepwater Horizon Disaster? Retrieved December 10, 2013, from The Oil Drum: http://www.theoildrum.com/node/6493 Barrett, P. M. (2013, November 25). Oil Spill Judge 'Deeply Dissapointed' in BP. Retrieved December 10, 2013, from BloombergBusinessweek: Companies & Industries: http://www.businessweek.com London South East. (2013). BP Share Charts (BP.). Retrieved December 10, 2013, from London South East: http://www.lse.co.uk Pulham, S., Hilaire, E., Fenn, C., & Department, G. R. (2010, September 28). BP Oil Spill: An Interactive Timeline. Retrieved December 10, 2013, from The Guardian: http://www.theguardian.com |
| Quality Initiatives: Telephone Auto-prompt Purgatory |
Extract: In Quality Digest, H. James Harrington relayed a disturbing tale about an experience he suffered while trying to book a simple flight to Canada (Evans, 2010, p. 42). The entire booking was done via phone through an automated voice prompt system which led Harrington down the proverbial rabbit hole. The initial call required five rings before the voice prompt system eventually picked up, after which was followed two dial menus, an extraordinarily long hold time, and eventually to an operator who only transferred him to another phone queue to begin the whole process again. This experience would leave anyone with a bad taste in their mouth, and is an incredible example of where quality control initiatives could drastically increase customer satisfaction.
|
Implementing Quality Initiatives
Forward thinking organizations are usually those establishments which have the ability to plan out and adapt their corporate strategies to forecasted changes in their customer expectations. That is, organizations that have clearly delineated concept engineering to discover their customers’ requirements (Evans, 2010, p. 104). These businesses are likely to accept quality initiatives as a matter of course. On the other hand, reactive organizations are those organizations which cannot accurately predict how their customers will perceive output on final release. In other words, even using concept engineering it is still going to take the product’s release into the wild to determine how customers will ultimately accept organizational output. Thus, acceptance of quality initiatives for this type of company comes from the ability to rapidly adapt to changing customer requirements, and therefore a commitment to continuous quality improvement (Evans, 2010, p. 23). An example of the first type of organization is the dairy market. Farmers have a specific customer base for which they must deliver their product. They know how their customers will react to bad product, and good product means more sales. Quality improvement is even mandated through governmental organizations such as the FDA. On the other hand, the second type of organization is shown in the entertainment business, specifically video games. These types of businesses will only know for certain if they have made a smash hit when knowledge of the product reaches market saturation. They can get a feel for what their customer base will think, but only the end results will truly determine whether they satisfy all their requirements. Quality improvement for these types of companies comes from trial and error. In some online cases, they can retroactively patch games to make them better, but for offline it is simply a matter of doing better next time through customer quality feedback and organizational strategy adjustment. Reference Evans, J. R. (2010). Quality & Performance Excellence: Management, Organization, and Strategy (6th ed.). Mason, OH, USA: Cengage Learning. ________________________________ 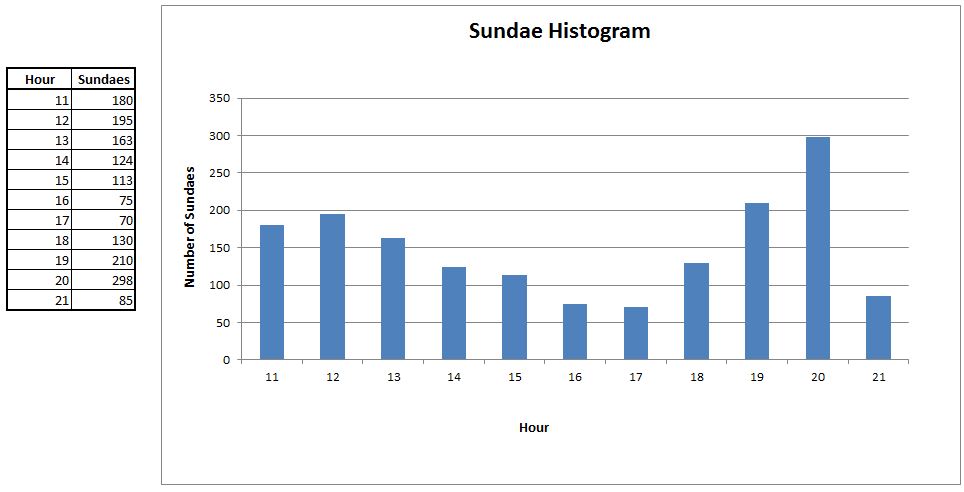
An example of a Histogram.
|
Quality Management Tools: Histogram
A histogram is a method of displaying the frequency of a given data set in the form of a bar graph (Sal Khan and CK-12 Foundation, 2011). In essence, the data on the X axis of the graph is the noun, or object to measure in terms of frequency. The Y axis is the adjective, or the frequency describing the object that exists on the X axis. Moreover, the object can be anything, and the frequency can be anything, so long as it can be expressed in the form of a mathematical range. Examples of this are: number of speeding tickets (expressed in tens) at each ten kilometers per hour, number of children born (expressed in millions) at which hour of the day, or number of cereal boxes on shelves (expressed in tens) by hour. Histograms are rigorously used when building data models in business intelligence (BI). For instance, expressing the number of sales of a given insurance product per hour. The X axis is the hour; the Y axis is the number of sales of each product based on a simple count. While at first this may not seem to be related to Information Technology (IT), the purpose of BI in the IT field is to provide business information to support business decision making. Since the data itself lives within the IT systems, it is the role of the BI consultant to pull and aggregate this data in order for management to better understand how the organization is operating. While these types of graphs are great at A:B comparisons for frequency, they do not express the change in frequency over a period of time. The Histogram can be modified to show this, however. As long as the number of objects are not too many (say less than ten), they can be grouped by period then placed on the same graph. E.g. three period groups can be placed on the X axis. Since all three groups are expressing the same frequency, they all share the same Y axis thus allowing for instant visual understanding of the movement of data over three periods. Nevertheless, there comes a point at which expressing data in this way (e.g. greater than three periods) becomes too cumbersome and a different method must be chosen (e.g. perhaps multiple histograms to express time periods, or even a line graph instead). Histograms are great tools to show the movement of data in a single period, or even a group of periods in the modified histogram. However, they come to a fault when trying to compare multiple types of objects in the same graph. This can be remedied by combining a histogram and standard bar chart. The histogram specifically compares two data values, e.g. a count versus a frequency, whereas a bar graph compares an object to a data point, e.g. an insurance product to the number of sales. How these are combined is through grouping of histogram objects into their graphing products. For instance, each hour is grouped by the individual insurance products being expressed, these are then shown on the X axis, since all are comparing the same frequency, the Y axis is the same for all data points. What is interesting about the histogram is that it can be used in conjunction with a simple check sheet to gather the data needed to be expressed. At each hour of the day, a stock is taken of a given cereal product, and a count is made of what is on the shelves. This data is then aggregated and made into a histogram based on the number of cereal boxes counted per hour. Thus the check sheet is used as a means of providing histogram data. Reference Sal Khan and CK-12 Foundation. (2011, February 21). Histograms. Retrieved January 2, 2013, from Khan Academy: https://www.khanacademy.org/math/arithmetic/applying-math-reasoning-topic/reading_data/v/histograms |
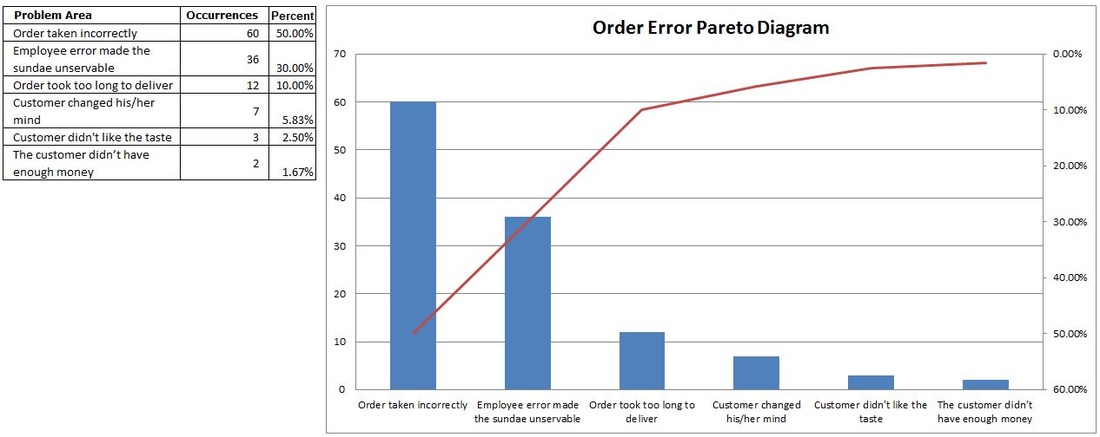
An example of a Pareto Diagram showing the highest instances of issues occurring in the fewest problem domains.
| Capability Maturity Model Integrated (CMMI): Process Model Integration |
Extract: The Capability Maturity Model Integrated, or CMMI, is a method of reviewing and moderating existing organizational processes in order to ensure they are operating at peak efficiency (Carnegie Mellon University, 2007). That is, the CMMI sits above all other existing processes and offers a way for owners of said processes to check that they are implementing their systems correctly. Its primary benefit is at the resource level, ensuring each process is provided with the correct tools and inputs needed to produce quality output. However, CMMI is not a process unto itself; it is a way of generating high level checklists to ensure existing processes operate correctly. This, in turn, leads to its primary drawback of introducing additional complexity into systems if not used correctly.
| Defining Metrics Effectively: Goal Question Metrics (GQM) |
Extract: Goal Question Metrics (GQM) is a technique where specific aims are defined and then questions towards those aims are applied from which metrics are assembled (Basili, Caldiera, & Rombach, 1994). This is important as it helps to address key software development issues such as early lifecycle defects and changing requirements. Both of these are important issues to resolve as soon as possible during any software project. Moreover, each is a necessary byproduct of any development project which, in general, cannot be bypassed.
Comment Box is loading comments...
